Relative Strength Index
I want to write a post about an indicator that I find quite useful.
Relative Strength Index (RSI).
What is it
Definition from Investopedia:
The relative strength index (RSI) is a momentum indicator used in technical analysis that measures the magnitude of recent price changes to evaluate overbought or oversold conditions in the price of a stock or other asset.
Basically, it’s something you can use to see if a stock has been over-bought or over-sold.
Why you should use it
You can use it to better understand the market(s) behind the stocks you are looking at. Understand what’s causing it to go up / down.
How to use it
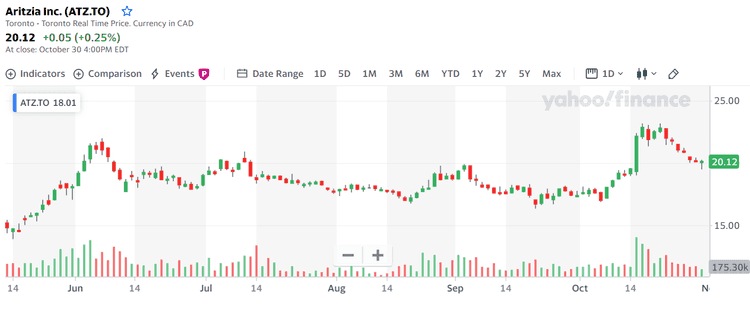
- Load up the graph of a stock. Here, I will use Aritzia Inc (ATZ.TO).
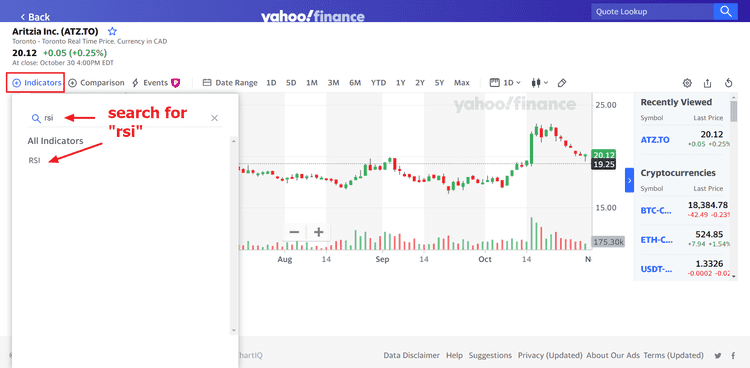
- Add an RSI Indicator
- Set up config
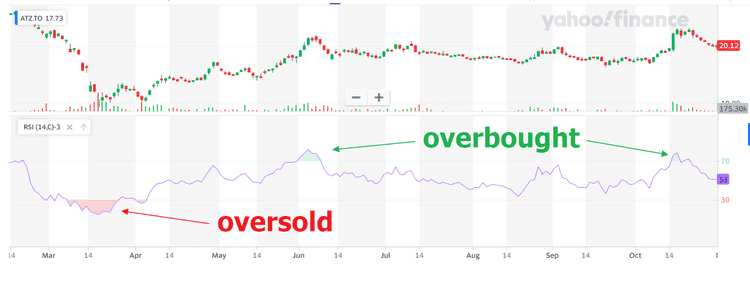
- Observe the graph
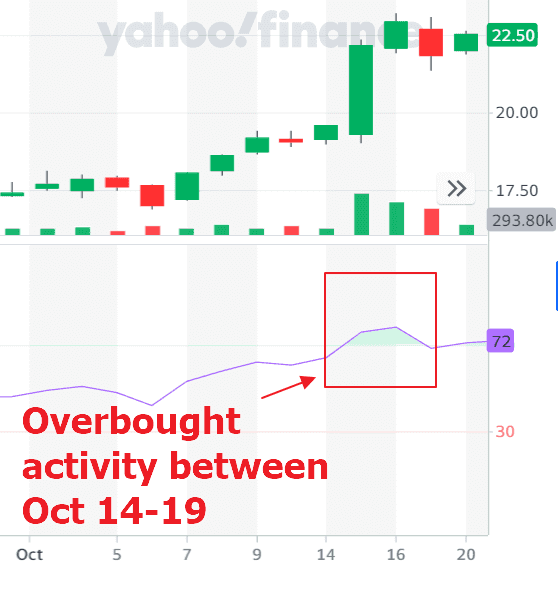
- Investigate overbought / oversold areas
- Do your research and find out if it’s justifiable
Bloomberg Terminal Function
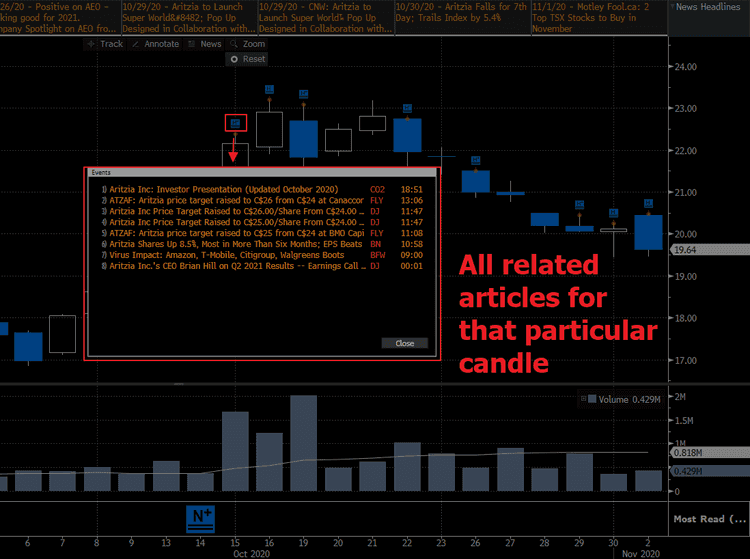
Shameless plug lol I work at Bloomberg and there is this one function on the Terminal that is related and super useful.
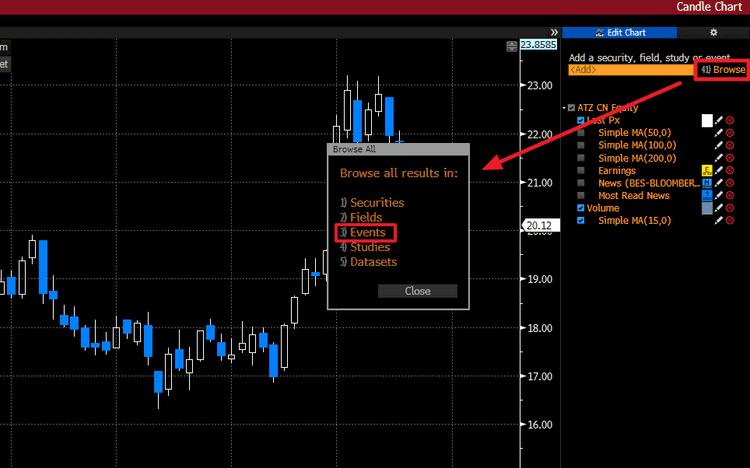
GPC <GO>
- Load up a graph using GPC <GO>
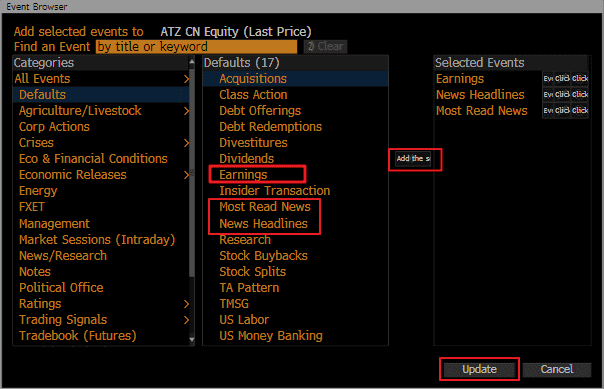
- Click on Browse and choose Events.
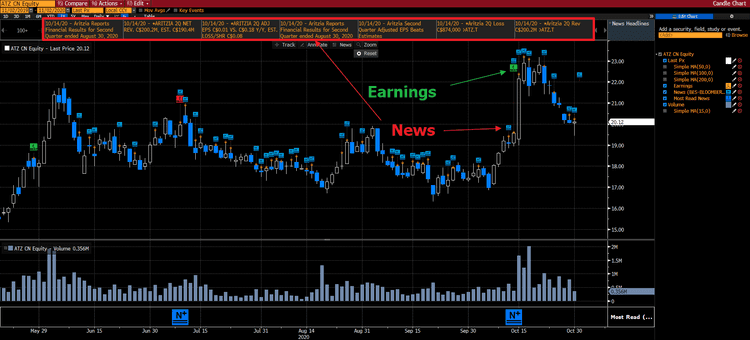
- Add whatever you want, but I like to add Earnings, Most Read News and News Headlines.
- Observe the graph
No, I wasn’t sponsored by Bloomberg or anything for this post. Just a cool tool I found on the Terminal during work and just wanted to share.
That’s all. Happy investing!
