Chrome Devtools Quick Tips
Coming from a mobile developer background, I really admire the maturity of web development tools. I have been going through Chrome Devtools recently, and it’s fantastic. Here are some things worth sharing.
First, I will quickly go over the basics then go through some useful things.
In this post, we will cover:
- Chrome DevTools in Brief (skip if you are already familar)
- Page Source Files
- Using snippets to speed up repetitive actions.
- So many breakpoints!!
Chrome DevTools
Press F12 and you will open up the Chrome Devtools.
I will briefly go over 3 parts of the tool.
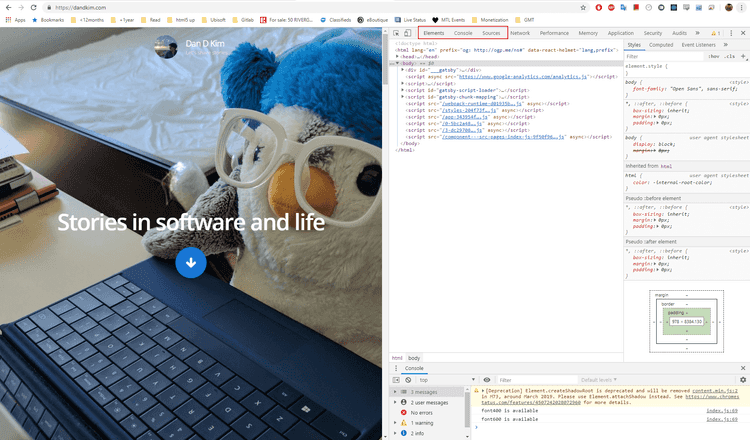
Elements
You can see the frontend code that makes up the website here. Useful for debugging frontend components.
Console
Useful for logging console outputs, as well as a Javascript playground.
Sources
You can see the source code of the website here. This is useful for debugging unexpected behavior, as well as studying someone else’s website :P
Ok, that’s it for the basics lol
On to the fun part.
Page Source Files
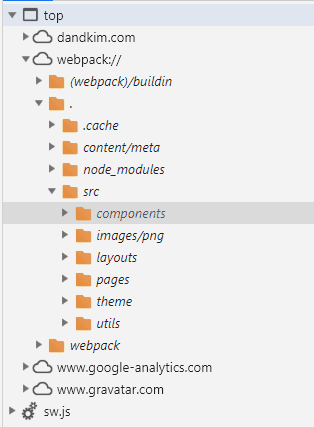
On my website dandkim.com, my source code is shown as it would on my own IDE.
Everything is broken down - src, components, utils, etc…
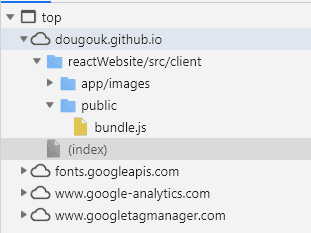
But let’s go to my student website dougouk.github.io (old and embarassing) and see what the sources show there.
The source code of the entire website is inside one big giant bundle.js file. This is unhelpful for debugging as the code is not structured.
If I wanted to fix this, I would just add the following line to my webpack.config.js.
module.exports = {
  devtool: '#eval-source-map',
  ...
}
After adding that, I should see the webpack showing the source code broken-down as it did for dandkim.com.
(I’m not gonna actually add and update it tho, cuz I already graduated and I could care less about my student website)
Snippets
Snippets are pretty useful for any repetitive frontend work.
They are Javascript code that are saved into your devtools and can be used on any website.
Simple example
Sources > Snippets > New Snippet
alert('Voila')Run it, and you will get the following:
Replacing text example
Let’s say I wanted to replace all occurences of cannabis with some other string on a website.
I can make a snippet with the following code:
document.body.innerHTML = document.body.innerHTML.replace(/cannabis/g, 'some of dat sweet sweet goodness');Go to https://www.bnnbloomberg.ca/marijuana and run the snippet.
Repetitive Clicking Example
I don’t have the most useful example here, but let’s say that I was so bored that I went to boredbutton.com.
That is pretty much the website. You click on the button and it will take you to a random website.
Now, I could have a snippet that will press the button for me. Lame, I know. I don’t have a good example, but you can probably take this for something more useful.
function click(element) {
    const clickEvent = new MouseEvent("click", {
        "view": window,
        "bubbles": true,
        "cancelable": false
    })

    element.dispatchEvent(clickEvent)
}

function clickBoredButton() {
    const getBoredButton = document.getElementsByName("submit")
    click(getBoredButton[0])
}

clickBoredButton()
Breakpoints
These are pretty much the same as breakpoints in any other IDE / language.
You can place breakpoints in the source code to stop code execution at a certain line.
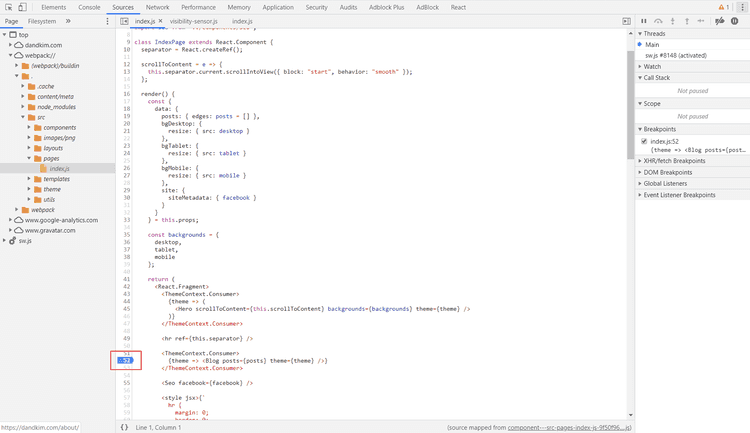
Back to my website dandkim.com, if I wanted to debug my website just before it loads my articles, I could place a breakpoint at src/pages/index.js L:52.
If I refresh my page, the website will stop loading when it reaches that code. I can then debug my Callstack or variables in my Scope.
Conditional Breakpoints
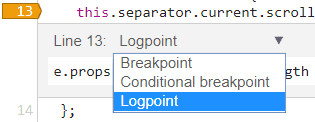
You can set breakpoints to pause execution only on certain conditions. Again, nothing new.
There are also Logpoints, which - as you guessed it - are used only for logging.
DOM Breakpoints
I didn’t know about this and found it pretty useful. You can basically set a breakpoint on the DOM itself.
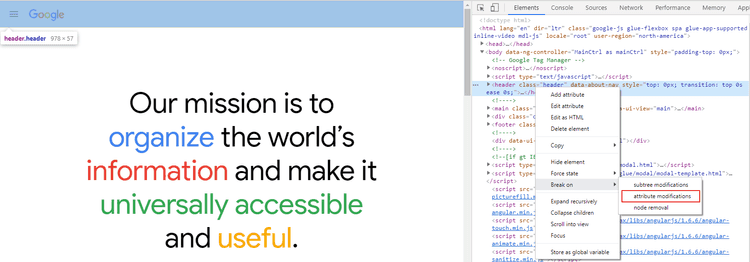
Let’s go to https://about.google
Notice how their top bar goes away when I scroll down, and animates back in when I scroll up. We can set a breakpoint on the DOM by right-clicking on the element from Elements tab > Break On > Attribute Modifications
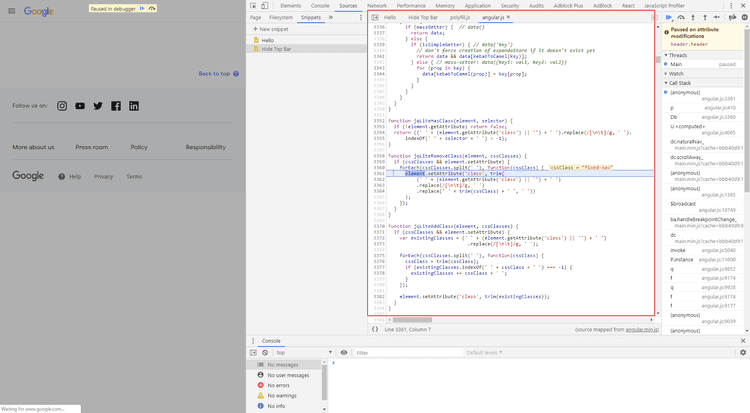
Notice how you get a blue indicator with the breakpoint :D
Now when you refresh the page, you will get a breakpoint on the angular.js code runs on the animation trigger.
XHR / Fetch Breakpoints
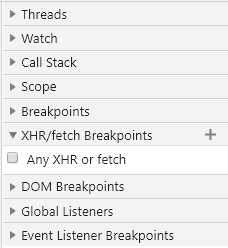
This breakpoint is pretty simple. You can set a breakpoint on any Ajax call.
If you set that to true, you will get a breakpoint on any Ajax request.
Specific URL
Getting a breakpoint on any Ajax request isn’t that useful. Instead, you can customize breakpoint to filter for specific urls.
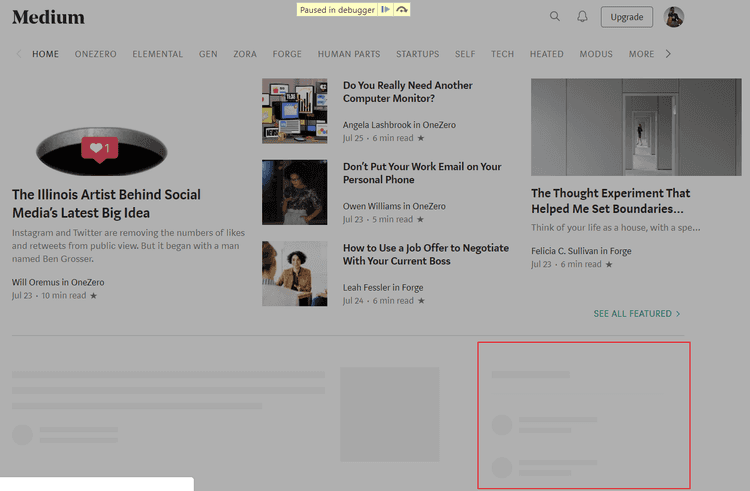
For example, you can set a filter for sidebar, go to medium.com, and see it pause execution on rendering the “Popular on Medium” sidebar.
Event Listener Breakpoints
This is pretty straightforward - it’s just that there’s a lot of different event listeners to know about.
Quick example is the mouse scroll - you can get a breakpoint on mouse wheel scroll, and it will pause execution whenever there is a scroll.
debugger
Lastly, you can get up a breakpoint anywhere in your code by adding debugger in your Javascript code.
...
debugger // Will pause execution here
...
That’s all for now! I will be diving deeper to find other useful features.
